An integrated environment for performing analysis on financial data, with full coverage of market data, corporation fundamentals, real-time database (log(n/k) access time), strong backtesting, multi-threaded strategy pipeline, real time trading, trade visualization, upstream validation, trade statistics, and operation automation. Essentially an all-in-one platform for financial trading and analysis automation. Written with JSwing, JavaFX, and JInteract. API usage include Yahoo Finance, Alpaca, and Apache HttpComponents.
Overview
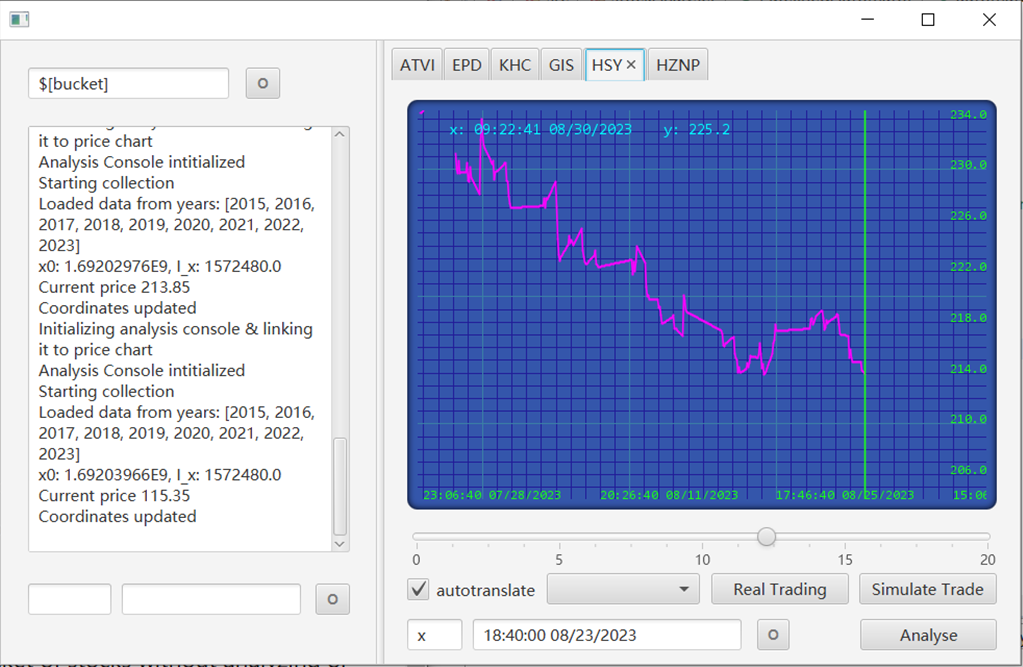
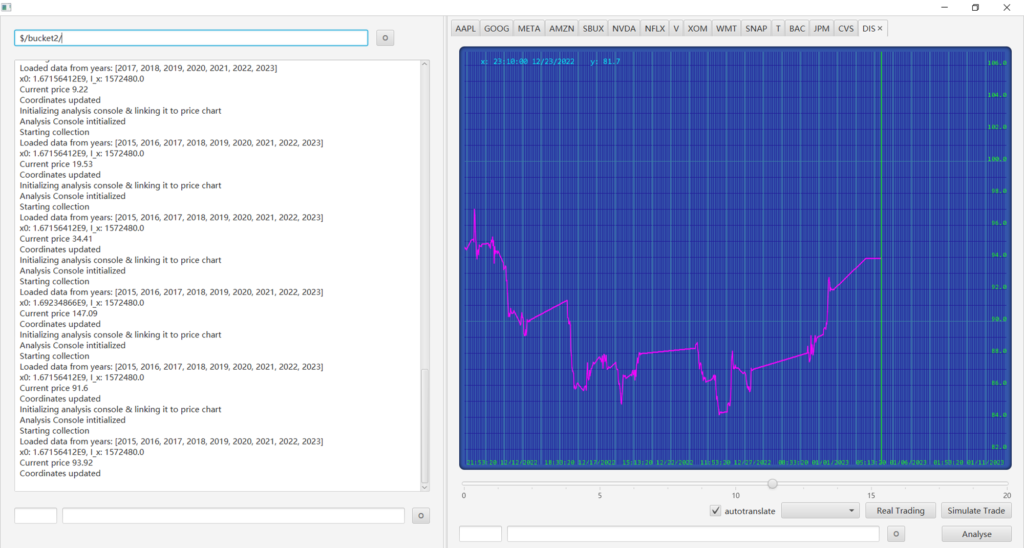
The intialization window is the entry point of the terminal. One can enter stock symbols in the top left corner to query single stocks from the Yahoo Finance API, or type ‘$’ followed automation commands to perform a sequence of actions on one or multiple stocks.
Automation commands:
1. $[bucket name/symbol] –> (Data collection): Load a bucket of stocks from local database and start data collection:
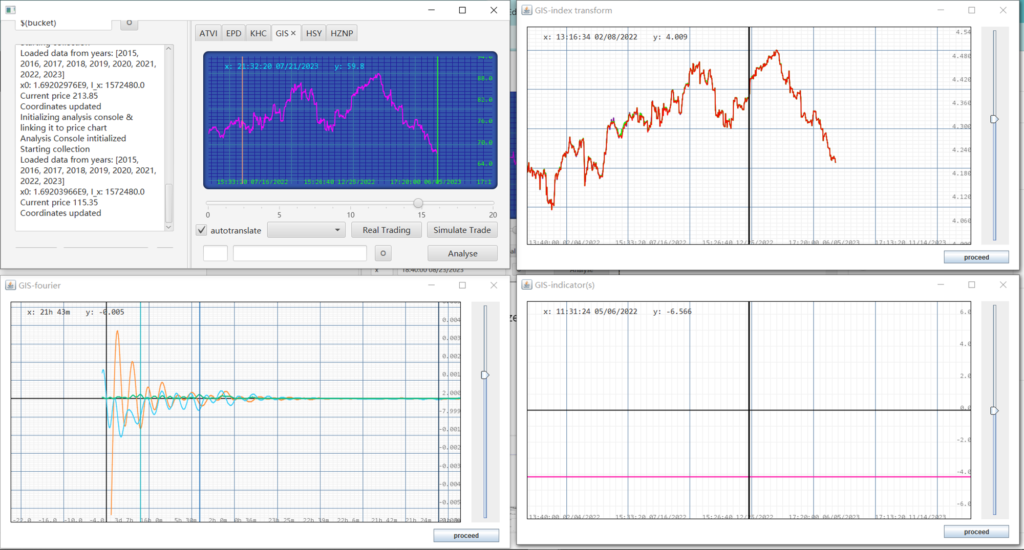
2. $(bucket name/symbol) –> (Fourier Analysis): Load a bucket of stocks from local database, start data collectino, and analyze their fourier spectrum in the past year:
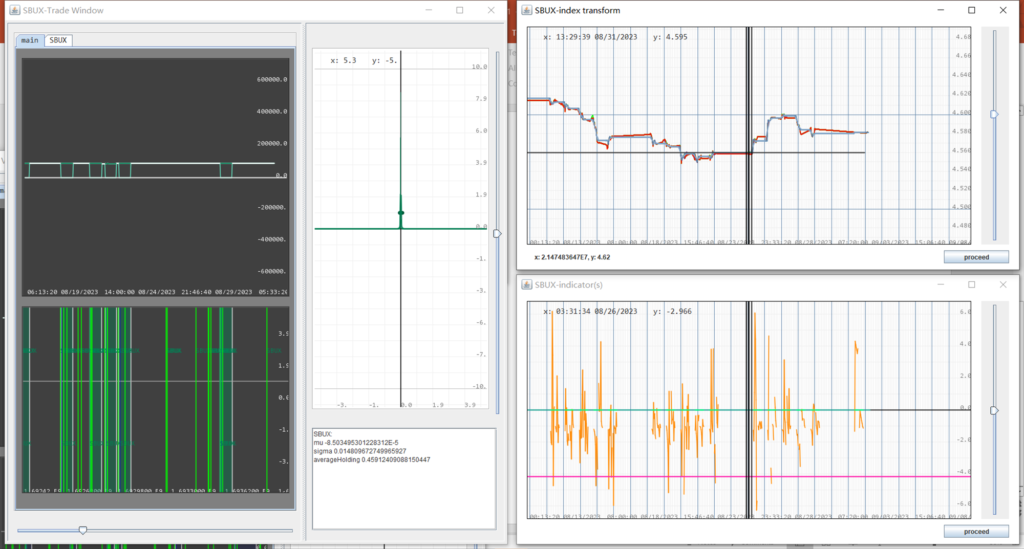
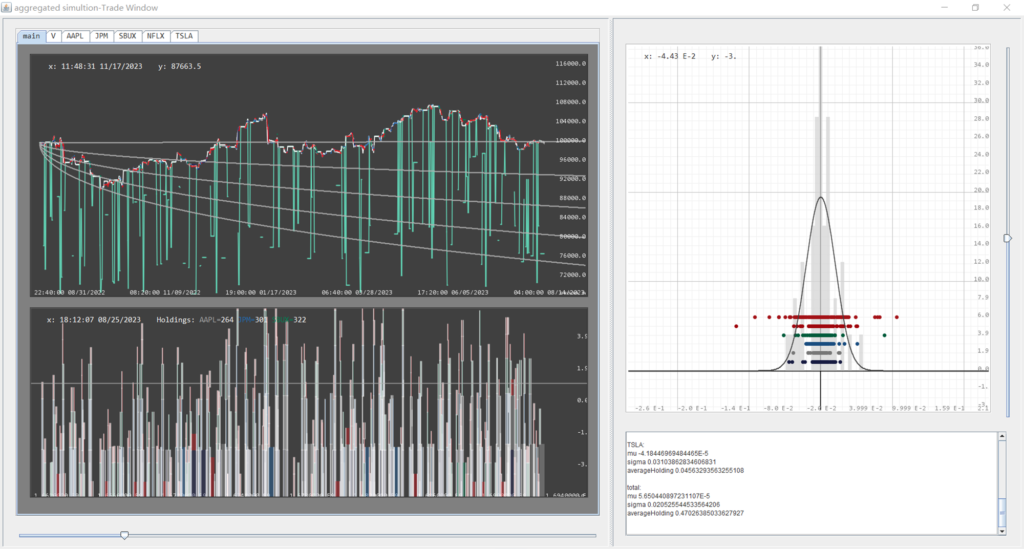
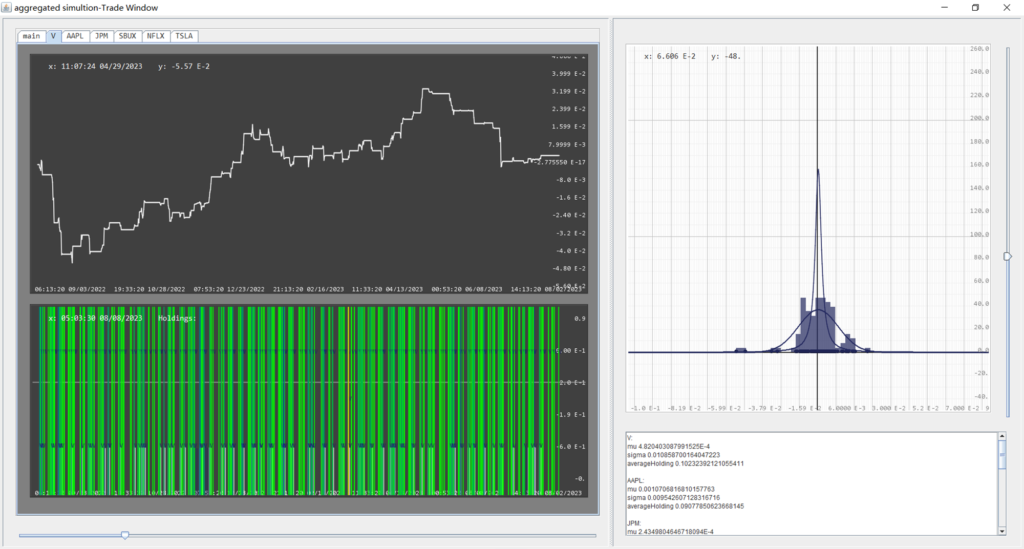
3. ${bucket name/symbol} –> (Analysis+Backtesting) Load a bucket of stocks, start data collection, analyze their fourier spectrum based on data between year-1 till year-2, prepare the strategy pipeline, and strong trade the individual strategy for each stock for the past year till present, then trade with an aggregated strategy for all of the stocks on a simulated multi-stock platform for the past year till present, then compute trade statistics when finished.
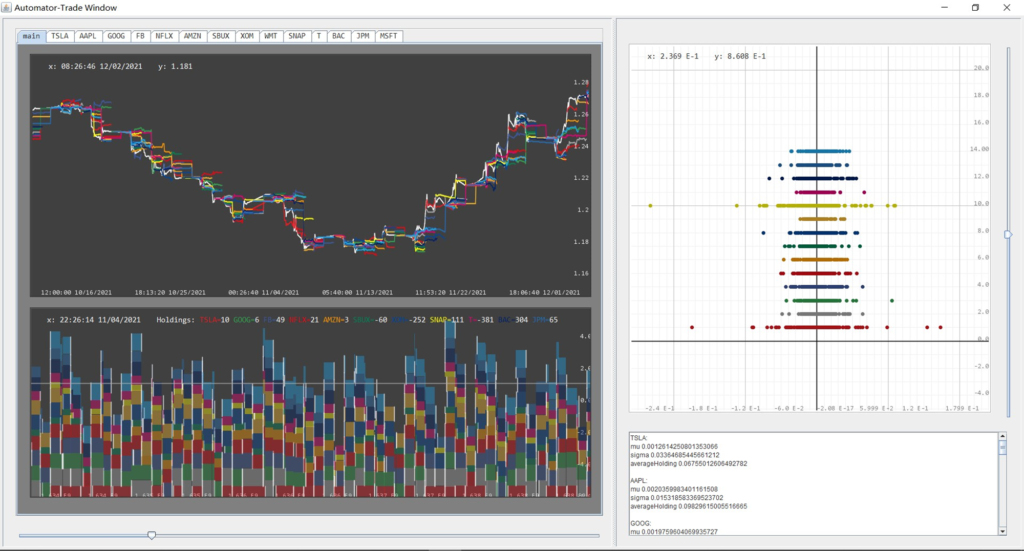
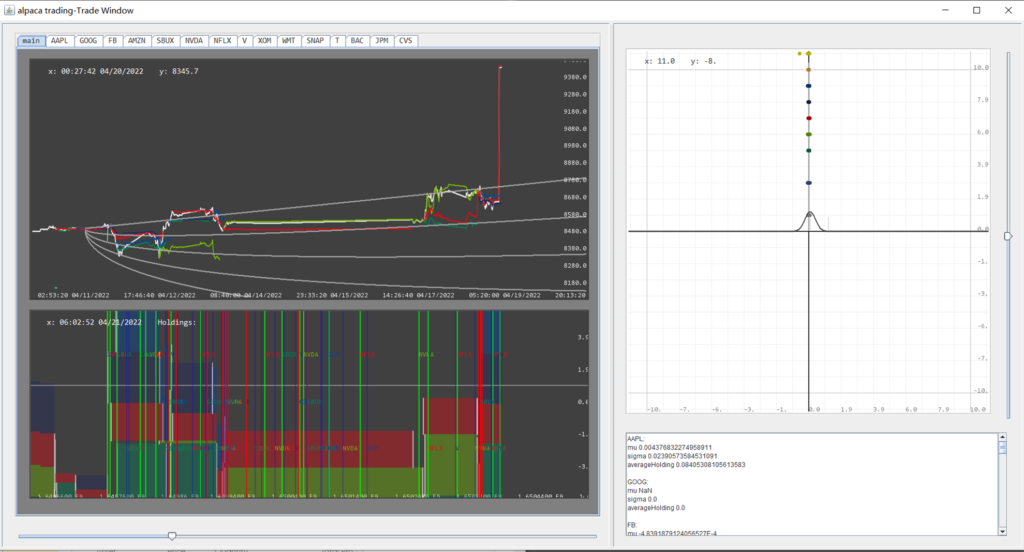
4. $/bucket name or symbol/ –> (Analysis+Real time automated trading) Load a bucket of stocks, start data collection, prepare the strategy pipelines for the past week, initialize local Alpaca Platform (dependency injection extending MultStockPlatform), retrace trading history of upstream Alpaca platform, and start trading session from present based on the aggregated strategy.
Project Diagram

Hover to zoom
The project is built with “sparse” modularity in mind. Every module is built as a service or on top of other services, such that one can build and iterate through new strategy pipelines using every service that are already in place.
Project Ecosystem
- Linearized Data
- A composite structure of linked list and sorted data pair of time sequenced data, this is the backbone of Stock Terminal — forming the abstraction of a mathematical function $f:\R\rightarrow\R$. Offers the central functionality of “get(double x)”, computes the interpolated value of the represented function between to data points with $\log(n)$ complexity.
- Can be linked to other LinearizedData to extend the definitino of the current function with $O(1)$ time complexity.
- Datasheet (extending CSV)
- Consisting of columns of linearized data, datasheet offers the abstraction of an “Excel sheet” with a uniquely specified time column.
- Can be concatenated with other datasheets with $O(1)$ time complexity, this could be used to merge multiple data sheets for different years into one datasheet, each columns of linearized data will subsequently be assembled. Has the ability to save “sparse” data with $O(n)$ complexity, $n$ being the number of unique time stamps.
- Database
- Loads and organizes datasheets under a root URL.
- AnalysisConsole
- Holds the algorithms for computing time series indicators and performing data analysis.
- PipelinedAnalysisConsole (extending AnalysisConsole)
- Holds the pipelined version of algorithms in AnalysisConosole, such that data can be passed around using a uniform interface.
- MultStockTrader
- Automates trading based on strategies of individual stocks, makes decisions to dynamically distribute fund in each stock.
- MultStockPlatform
- Simulates/performs the said trades and makes records of them through dependency injection.
- AlpacaPlatform (extending MultStockPlatform)
- Handles upstream traffic and accounting validation, on top of functionalities of MultStockPlatform.
- Automator
- Acts as the agent that operates the Stock Terminal ecosystem: retrieves stocks, assembles strategy pipelines, initialize backtesting sessions, inject platform dependencies, and finally initiating the data feeds. This is where users can decide how they would like to use the terminal, with minimal coding. In the future, this part can be written with a UI of Node-Graph representation.